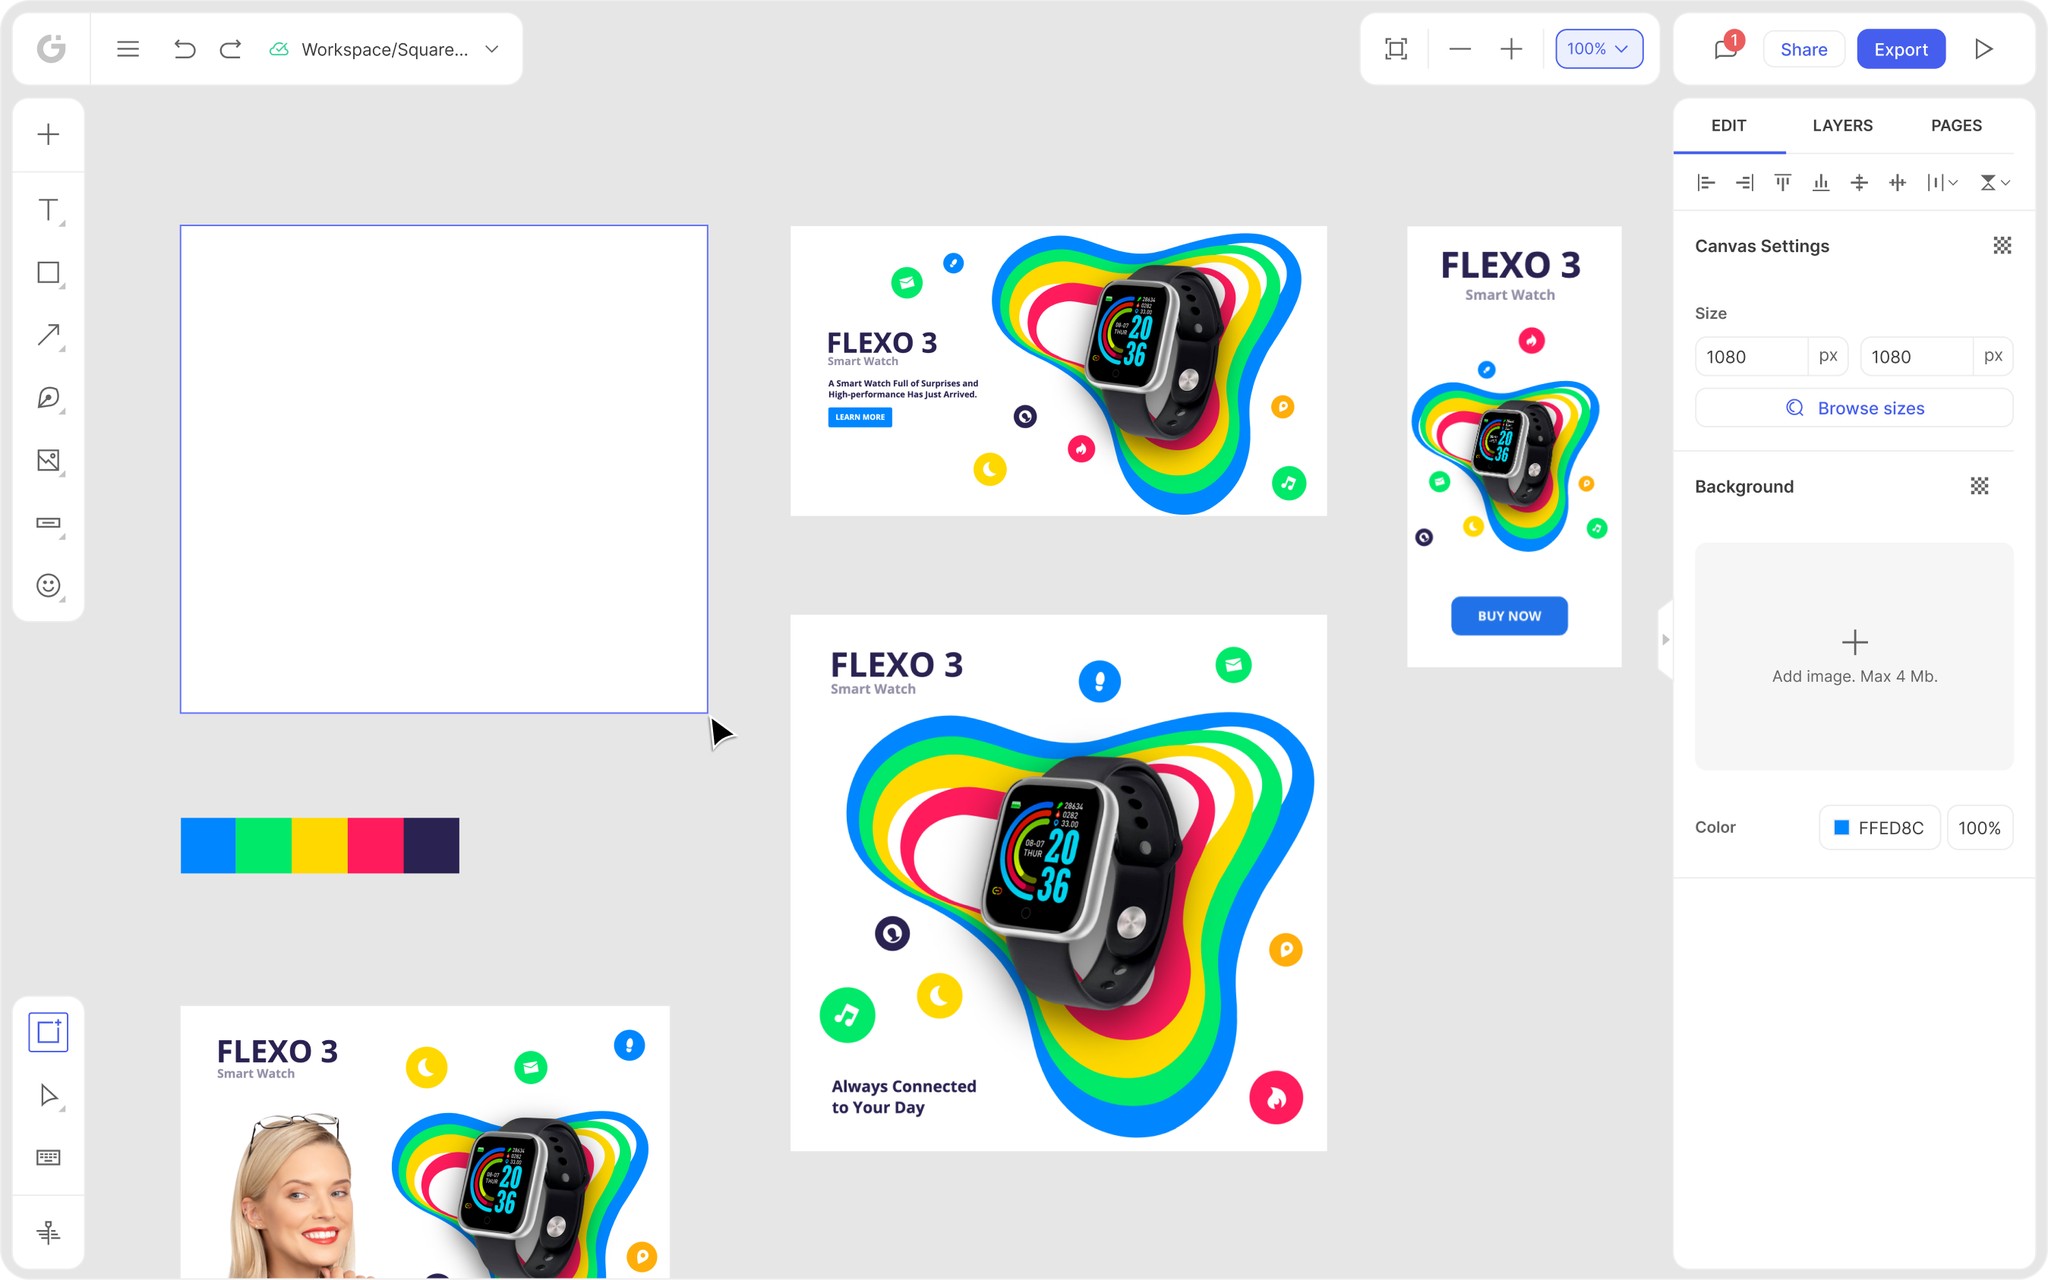
We’re thrilled to announce that Glorify is officially partnering with Contra! This collaboration opens up exciting opportunities for designers, marketers, and creators in the Glorify community.
Posted May 19, 2023
•

Glorify Team
Design
4 Best Infographic Tools For Creating Stunning Visuals
What are Infographics?
Infographics are easily memorable and visually engaging content that you use to illustrate data, stories, or ideas.

Although most people have charts or graphs in mind when they think of infographics, they are so much more than that. Modern-day infographics consist of stunning visuals.
But to create those captivating visuals, you need to know what to pay attention to and what information is relevant to include.
And this iswhere we, at Glorify, can helpyou elevate your design to that high-quality, sought-after graphic designaesthetic. Our team of design experts have years of experience behind them andtheir knowledge is ready for you to use to your creative advantage. Togetherwith the team you can show your creative platform to the world and show themwhat they have been missing out on.
Thus, before sharing the best infographic tools, let’s see how to make your infographic stand out.
How to Make Your Infographic Stand Out?
If you want your infographic to stand out, you need to make sure you infographics:
Are well-designed and informative - Your infographics should include only relevant information.
Contain accurate data - Nothing will turn off your audience more than inaccurate data.
Include high-quality images - Use images that are high resolution, so they look good when they’re shared on social media.
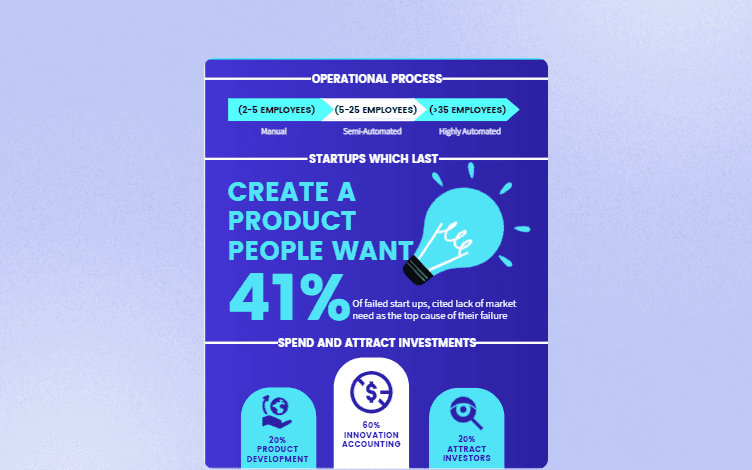
What are some other things you should bear in mind?
Choose images relevant to your topic.
Tell a story. A great infographic tells a story that people will want to share with their friends and followers. Use your data to tell a compelling story that will resonate with your audience.
Use clean lines, easy-to-read fonts, and plenty of white space to make your infographic easy on the eyes. If your infographic is cluttered or difficult to read, people will likely just scroll past it.
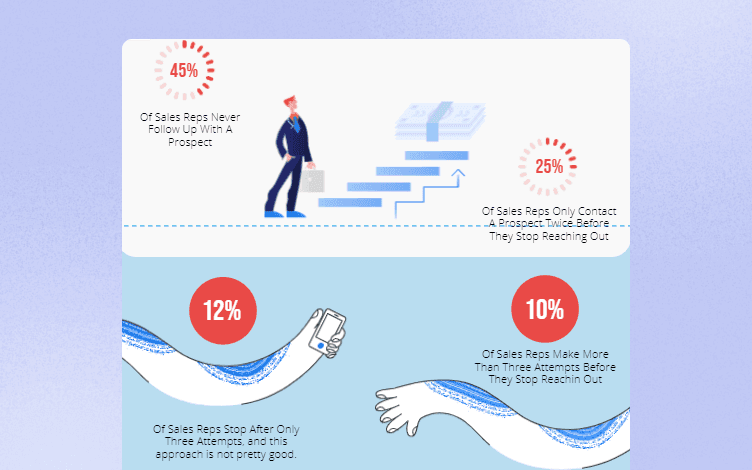
Don’t forget that people are visual creatures and that an infographic is only as good as its design. So finally, let’s go through our top picks of infographic tools!
4 Best Infographic Tools For Creating High-Quality Visuals
1. Glorify

Glorify is an all-in-one graphic design platform helping non-designers and eCommerce store owners create stunning visuals to boost traffic, conversion, marketing efforts, etc.
Actually, due to its versatility and the vast range it covers, there is really not much you can’t do with Glorify.
Before we show you how to create amazing infographics with Glorify, let’s give you a glimpse of Glorify’s “hottest” features.
What are Glorify’s Highlights?
Regardless of whether you are a beginner or a seasoned pro, you’ll benefit from features that Glorify has in store for you:
Infinite Canvas - Whether you want to work on brand identity, prepare marketing materials, brainstorm with your team, the Infinite Canvas feature enables you to do just that.
Mockups - This feature is precious for eCommerce store owners because it enables them to showcase their products more realistically. On the other hand, it is great for designers because it helps them spot any flaws in their design before publishing it.
Brand Kit and Template Bundles - These two features make a pretty formidable force when joined together. You can implement your company’s colors and logos in your designs across all the platforms in the exact format. Glorify made the whole process automated.
Photo Editing Features - There are many photo editing features but let’s mention: the background remover, annotation tool to highlight your product’s features, smart resizing tool, etc.
Share and Export - Once you’ve finished with your design, you can share it or export it to your website, store or social media.

Now let’s see how Glorify can help you create scroll-stopping infographics.
How to Create Stunning Infographics with Glorify?
On sign up, you can immediately see the Template Gallery.
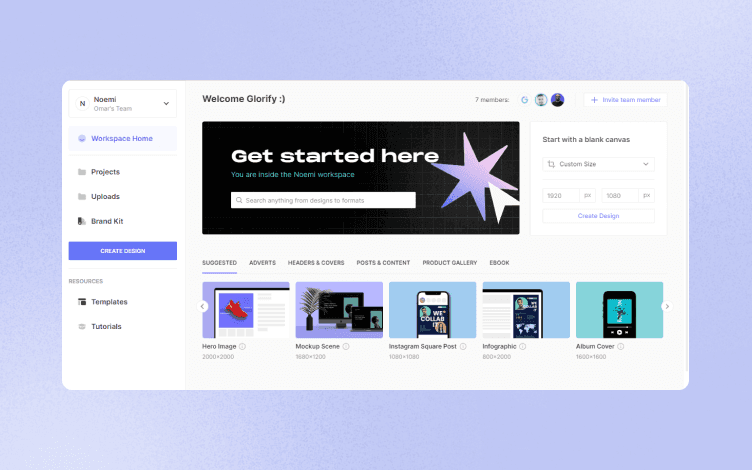
Since our topic is Infographics, let’s choose that template and show you how in a few clicks and in a matter of minutes you can create an engaging infographic.
Step #1 – Dashboard
When you choose the desired template you will land on Glorify’s dashboard.
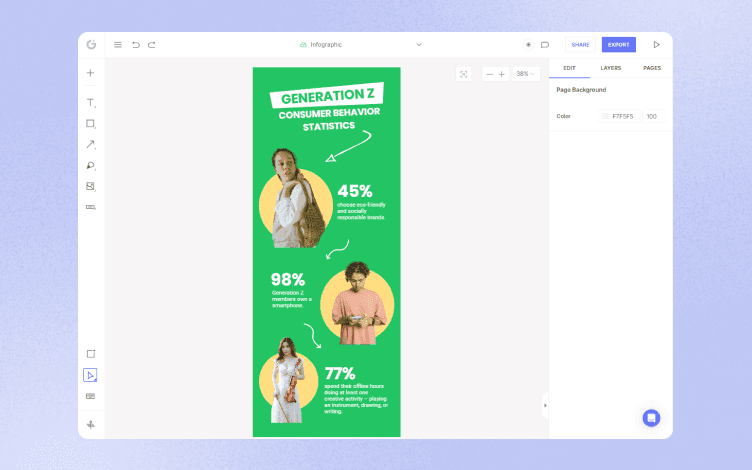
As you can see, there are two panels, one on the left and one on the right. The left-side panel is home to editing elements such as shapes, text, free images, mockup objects, logos, effects, etc.
The right-side panel offers features such as layers, BG remover, color and text edits, etc.
Both panels are super-intuitive – you just need to click on the element you want and upload it.
It is worth mentioning that you can also upload your images.
Step #2 – Editing
Once you’ve got acquainted with the dashboard, it’s time to play and explore the ways to create that perfect infographic.
For starters, you can change the background colors to align them more with your brand identity and colors. Moreover, you can change the images.
Change the Background and Colors
Compared to the image from Step 1, you can see how you can change the images and the background color in the image below.
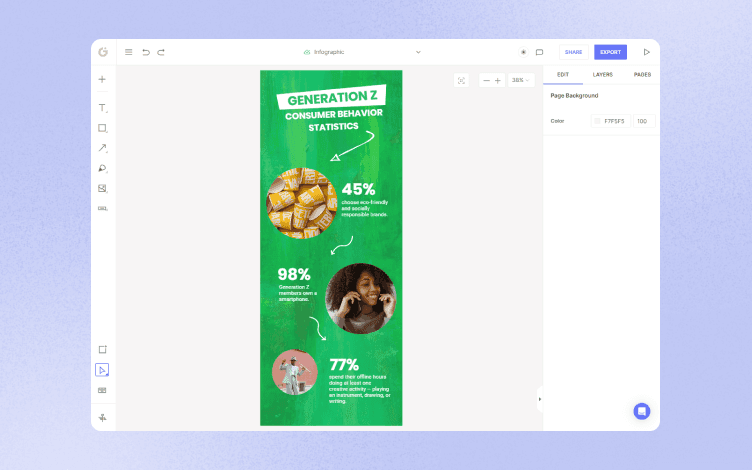
You can choose the images from the Free Image Elements on the left side. This is also how you can change the background color. You can add the glitter effect from the left-side panel.
Change the Text
It goes without saying that no matter which template you use, you will have to edit the text to meet your needs and requirements.
Like everything else on the dashboard, changing text only takes a few clicks – click on the part you want to change, and from there on, you can play with the font, size, opacity, drop shadow, etc.
All the editing options are located on the right-side panel.
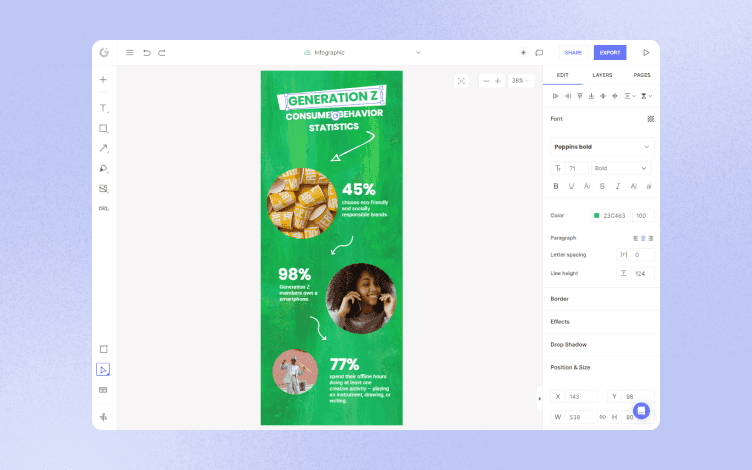
The design in the image above is far from finished, but you can get an idea how things work.
Pricing
Glorify offers three plans, one free and two paid ones.

Overall, Glorify is a great tool, but let’s see what other tools are on our list of the best infographic tools.
2. Piktochart
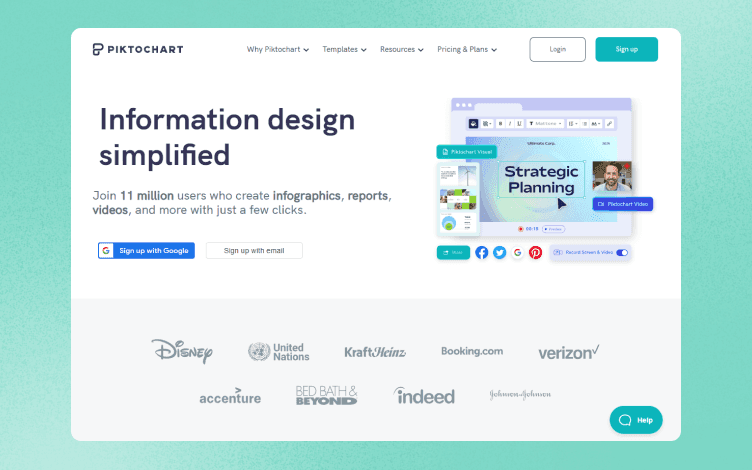
Piktochart is a user-friendly infographic maker that allows you to create beautiful visuals for your data. With Piktochart, you can easily create infographics, charts, and maps that are both informative and visually appealing.
It is fair to say that Piktochart, as the name may suggest, is really dedicated to infographics and similar formats.
You can choose from +230 infographic templates and change images or styles. In addition, there are more formats, ranging from vertical and presentation sizes to posters.

According to the creators of Piktochart, you can create a customized infographic in under half an hour.
Furthermore, there is a collaboration option regardless of the plan you are using. This feature, in particular, makes Piktochart popular.
Pricing
Piktochart has one Free and two paid plans.

Number three on our list of the best infographic tools is reserved for Venngage.
3. Venngage

Venngage is a graphic design tool solely dedicated to infographics. Although it has hundreds of infographic templates, and it may seem like a small number, the total amount is huge because Venngage offers so many subcategories and specialized sections.
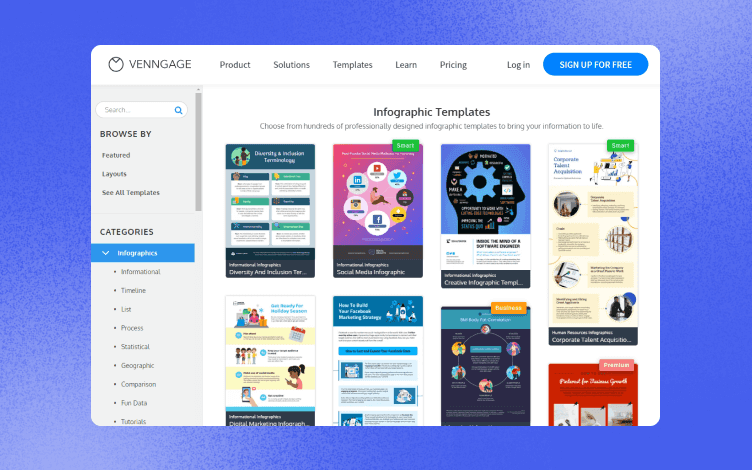
As you can see, there are informational, statistical, fun data, tutorials, and many other infographics.
A downside of this great tool is that you can only create infographics and that many advanced features are only part of the paid plans.
Speaking of which, let’s check Venngage’s pricing plan.
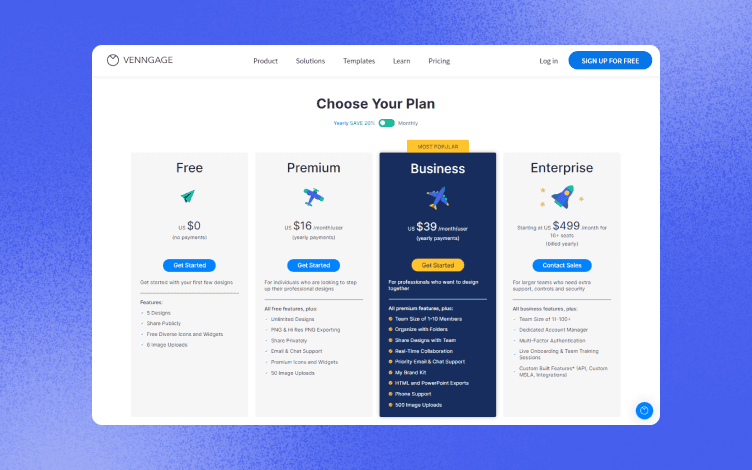
Pricing
There are four plans, including the Free plan.
So, who’s next on our list? Does Snappa ring any bells?
4. Snappa
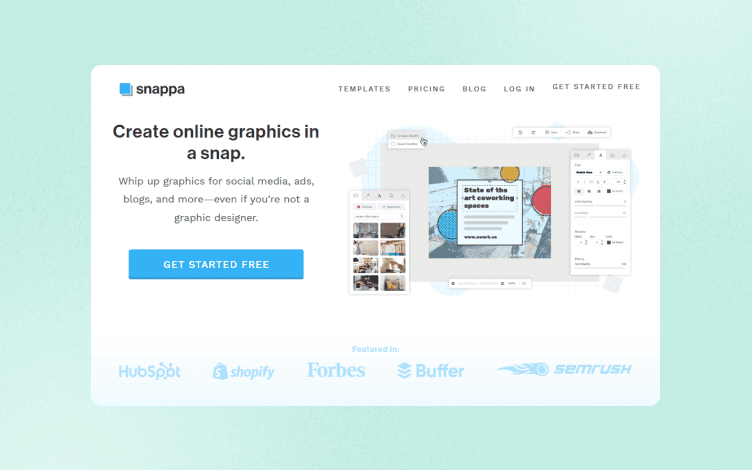
The moment you land on Snappa’s website, you get a vibrant and youth-like feeling. And it reflects in their designs.
They are quite colorful and dynamic, tailored primarily for social media.

However, that doesn’t mean you can’t create infographics with them. On the contrary, there are plenty of ready-made templates to choose from and a vast number of high-resolution images.
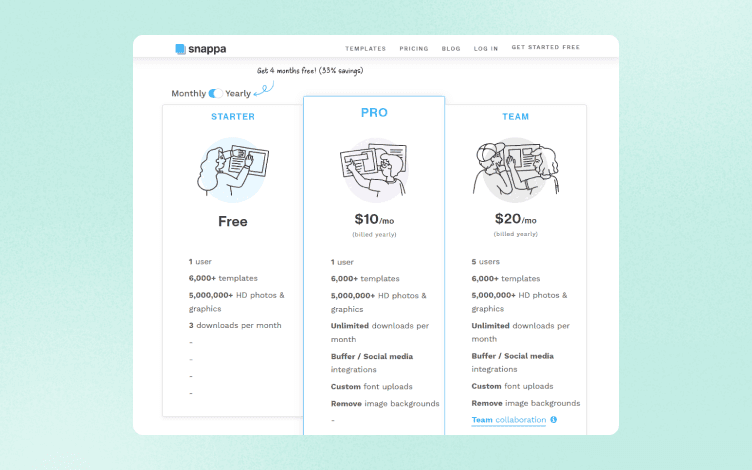
What makes Snappa really popular is that its free plan has many features of the paid plans. The most significant difference is the number of monthly downloads.
Of course, every tool has flaws, and Snappa is no exception. There aren’t any data visualization tools and no pre-designed text blocks.
Pricing
Snappa offers one free and two paid plans.
We’ve reached the end of our list of the best infographic tools. Let’s quickly sum everything up.
Wrapping It Up
In addition to being informative, infographics are also a great way to get your audience to take action. With so many websites, apps, and websites, the information you can present to your audience can be overwhelming.
Thus, infographics can help break down the information.
But if you’re not using the right tools, your infographic won’t look as good as it could. So how to pick the right one? If you’re solely interested in creating infographics, Venngage and Snappa offer you the greatest range, no doubt about that.
Piktochart could be your thing if you want to expand the story, but if you only want to go with the Free plan, your designs will have a watermark. Therefore, our choice is Glorify.
And yes, we may sound a bit biased, but taking everything into account, Glorify seems to be the most versatile platform, eCommerce-friendly, and with the best Free plan.
So, instead of taking our word for it, create your free account and improve your business with stunning visuals that take only a few clicks and minutes to create.
Features
Alternatives
© 2019-2024 Glorify App - All rights reserved.


